U.S. Hourly Precipitation Data
Precipitation Hourly
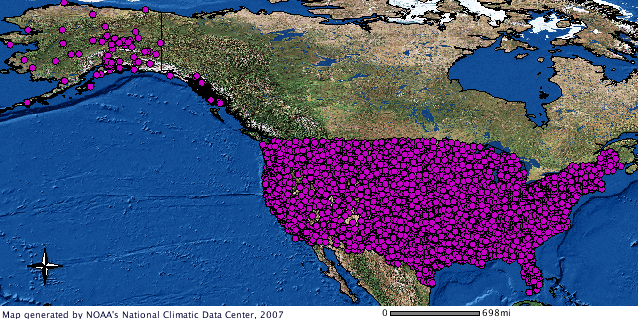 Hourly Precipitation Data GIS image
Hourly Precipitation Data (HPD) is digital data set DSI-3240, archived at the National Climatic Data Center (NCDC). The primary source of data for this file is approximately 5,500 US National Weather Service (NWS), Federal Aviation Administration (FAA), and cooperative observer stations in the United States of America, Puerto Rico, the US Virgin Islands, and various Pacific Islands. The earliest data dates vary considerably by state and region: Maine, Pennsylvania, and Texas have data since 1900. The western Pacific region that includes Guam, American Samoa, Marshall Islands, Micronesia, and Palau have data since 1978. Other states and regions have earliest dates between those extremes. The latest data in all states and regions is from the present day. The major parameter in DSI-3240 is precipitation amounts, which are measurements of hourly or daily precipitation accumulation. Accumulation was for longer periods of time if for any reason the rain gauge was out of service or no observer was present. DSI 3240_01 contains data grouped by state; DSI 3240_02 contains data grouped by year.
- Cite dataset when used as a source.
- NCEI DSI 3240_01
- NCEI DSI 3240_02
- gov.noaa.ncdc:C00313
| Search Data |
|
| Download Data |
|
| Distribution Formats |
- CSV
- fixed-length ASCII text
- ArcGIS
- KMZ
- PDF
|
| Ordering Instructions |
Contact NCEI for other distribution options and instructions. |
| Distributor |
NOAA National Centers for Environmental Information
ncei.info@noaa.gov
|
| Dataset Point of Contact |
Customer Engagement Branch
NOAA National Centers for Environmental Information
1-828-271-4800
ncei.orders@noaa.gov
|
| Time Period |
1940-01-01 to 2013-12-31 |
| Spatial Bounding Box Coordinates |
West: 130.0
East: -60.0
South: -15.0
North: 72.0
|
| Spatial Coverage Map |
|
| Dataset Information |
|
| General Documentation |
|
| Associated Resources |
- Hourly Precipitation Data (HPD) Publication
|
| Publication Dates |
|
| Data Presentation Form |
Digital table - digital representation of facts or figures systematically displayed, especially in columns
|
| Dataset Progress Status |
Under development - data is currently in the process of being created |
| Data Update Frequency |
As needed |
| Purpose |
This dataset contains historical hourly precipitation observations for selected U.S. stations. Data values are typically delayed six months or more. |
| Dataset Citation |
- Cite dataset when used as a source.
|
| Cited Authors |
- User Engagement and Services Branch
DOC/NOAA/NESDIS/NCDC > National Climatic Data Center, NESDIS, NOAA, U.S. Department of Commerce
- User Engagement and Services Branch
DOC/NOAA/NESDIS/NCDC > National Climatic Data Center, NESDIS, NOAA, U.S. Department of Commerce
|
| Originators |
- User Engagement and Services Branch
DOC/NOAA/NESDIS/NCDC > National Climatic Data Center, NESDIS, NOAA, U.S. Department of Commerce
|
| Publishers |
- DOC/NOAA/NESDIS/NCEI > National Centers for Environmental Information, NESDIS, NOAA, U.S. Department of Commerce
- DOC/NOAA/NESDIS/NCDC > National Climatic Data Center, NESDIS, NOAA, U.S. Department of Commerce
|
| Theme keywords |
Global Change Master Directory (GCMD) Science Keywords
- Earth Science > Atmosphere > Altitude > Station Height
- Earth Science > Atmosphere > Precipitation > Precipitation Amount
- Earth Science > Atmosphere > Precipitation > Precipitation Rate
- Earth Science > Atmosphere > Precipitation > Liquid Precipitation > Rain
- Earth Science > Atmosphere > Precipitation > Solid Precipitation > Snow
|
| Data Center keywords |
Global Change Master Directory (GCMD) Data Center Keywords
- DOC/NOAA/NESDIS/NCEI > National Centers for Environmental Information, NESDIS, NOAA, U.S. Department of Commerce
- DOC/NOAA/NESDIS/NCDC > National Climatic Data Center, NESDIS, NOAA, U.S. Department of Commerce
|
| Place keywords |
Global Change Master Directory (GCMD) Location Keywords
- Geographic Region > Polar
- Geographic Region > Mid-Latitude
- Geographic Region > Equatorial
- Continent > North America > United States Of America
- Ocean > Atlantic Ocean > North Atlantic Ocean > Caribbean Sea > Puerto Rico
- Ocean > Atlantic Ocean > North Atlantic Ocean > Caribbean Sea > Virgin Islands
- Ocean > Pacific Ocean > Central Pacific Ocean > Hawaiian Islands
- Ocean > Pacific Ocean > Western Pacific Ocean > Micronesia > Guam
- Ocean > Pacific Ocean > Central Pacific Ocean > American Samoa
- Ocean > Pacific Ocean > Western Pacific Ocean > Micronesia > Marshall Islands
- Ocean > Pacific Ocean > Western Pacific Ocean > Micronesia
- Ocean > Pacific Ocean > Western Pacific Ocean > Micronesia > Palau
|
| Stratum keywords |
Global Change Master Directory (GCMD) Location Keywords- Vertical Location > Land Surface
|
| Use Constraints |
- Cite dataset when used as a source.
- Use liability: NOAA and NCEI cannot provide any warranty as to the accuracy, reliability, or completeness of furnished data. Users assume responsibility to determine the usability of these data. The user is responsible for the results of any application of this data for other than its intended purpose.
|
| Access Constraints |
- Distribution liability: NOAA and NCEI make no warranty, expressed or implied, regarding these data, nor does the fact of distribution constitute such a warranty. NOAA and NCEI cannot assume liability for any damages caused by any errors or omissions in these data. If appropriate, NCEI can only certify that the data it distributes are an authentic copy of the records that were accepted for inclusion in the NCEI archives.
|
| Fees |
- In most cases, electronic downloads of the data are free. However, fees may apply for custom orders, data certifications, copies of analog materials, and data distribution on physical media.
|
| Lineage information for: dataset |
|---|
| Lineage Statement |
The data in this file are a combination of original observations of hourly and daily accumulated precipitation. Precipitation values are checked and edited as necessary by an automated and manual edit. |
| Processing Steps |
- Fischer-Porter precipitation gauges record data on punched paper tapes. A device known as the Mitron reader translates the data at NCDC. The Universal Rain gauge records data on paper charts. The precipitation recorded on the charts is then digitized. The data from the Surface Climate Information Archive and Dissemination System (SCIADS) or primary stations is also entered.
|
| Source Datasets |
- Data from weighing rain gages, Fischer-Porter gages, Universal rain gages and in recent years, more modern measuring equipment in conjunction with automated recording sites
- Description of Source: Keyed and digitized rain gage forms (historic) and digitally captured precipitation from automated stations (modern).
- Temporal extent used: 1940-01-01 to 2013-12-31
|
| Lineage information for: repository |
|---|
| Processing Steps |
- 2015-04-22T00:00:00 - NOAA created the National Centers for Environmental Information (NCEI) by merging NOAA's National Climatic Data Center (NCDC), National Geophysical Data Center (NGDC), and National Oceanographic Data Center (NODC), including the National Coastal Data Development Center (NCDDC), per the Consolidated and Further Continuing Appropriations Act, 2015, Public Law 113-235. NCEI launched publicly on April 22, 2015.
|
| Acquisition Information (collection) |
|---|
| Instrument |
- AWS > AUTOMATED WEATHER SYSTEM
- RAIN GAUGES
|
| Platform |
|
Last Modified: 2023-06-23
For questions about the information on this page, please email:
ncei.info@noaa.gov