Barograms / Barograph Charts
EV2 - Barograms
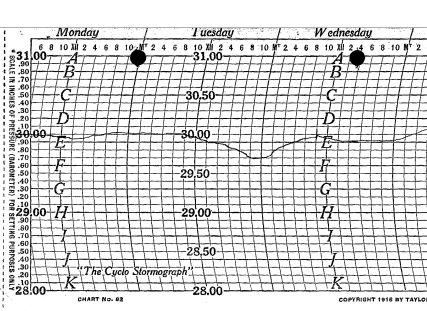 Image example
Barograms are weekly rectangular charts recording barometric pressure at a given station. The barograph is an instrument that makes a continuous pen and ink trace of the changing atmospheric pressure on a chart. The barograph chart is also called a barogram. There were also measurements made using other types of barometers, and recorded on paper forms. Pressures were in millibars or inches of mercury. Many of these barograms and forms were provided to the archive by U.S. agencies: National Weather Service (NWS), Federal Aviation Administration (FAA), U.S. Air Force Air Weather Service (AWS), and the U.S. Navy Weather Service. The archive includes barograms and forms from other sources, including merchant ships at sea.The archive has hundreds of thousands of barograms in physical media (primarily microfilm, though also includes microfiche and paper). The period of record begins in the late 19th century, spans the entire 20th century, and continues, though in smaller volume, into the present. A limited selection of scanned barograms are available digitally as well.
Dataset Citation
- Cite this dataset when used as a source.
Dataset Identifiers
- NCEI DSI 3900_01
- NCEI Physical Archive Collection: CHTBAR
- gov.noaa.ncdc:C01005
ISO 19115-2 Metadata
gov.noaa.ncdc:C01005
| Order Data |
|
| Distribution Formats |
|
| Ordering Instructions | Contact NCEI for other distribution options and instructions. |
| Distributor |
NOAA National Centers for Environmental Information ncei.info@noaa.gov |
| Dataset Point of Contact | Customer Engagement Branch NOAA National Centers for Environmental Information 1-828-271-4800 ncei.orders@noaa.gov |
| Time Period | 1878-01-01 to Present |
| Spatial Bounding Box Coordinates |
West: -180.0
East: 180.0
South: -90.0
North: 90.0
|
| Spatial Coverage Map |
| General Documentation |
|
| Publication Dates |
|
| Data Presentation Form | Hardcopy image - image archived in analog format Hardcopy image - image archived in analog format |
| Dataset Progress Status | Ongoing - data is continually being updated |
| Data Update Frequency | Not planned |
| Supplemental Information | The US Weather Bureau assigned the forms as Form Number 1068. |
| Purpose | To maintain raw, historical pressure data for reference in meteorological and climatological research. |
| Use Limitations |
|
| Dataset Citation |
|
| Cited Authors |
|
| Originators |
|
| Publishers |
|
| Theme keywords |
Global Change Master Directory (GCMD) Science Keywords
|
| Data Center keywords |
Global Change Master Directory (GCMD) Data Center Keywords
|
| Platform keywords |
Global Change Master Directory (GCMD) Platform Keywords
|
| Instrument keywords |
Global Change Master Directory (GCMD) Instrument Keywords
|
| Place keywords |
Global Change Master Directory (GCMD) Location Keywords
|
| Stratum keywords |
Global Change Master Directory (GCMD) Location Keywords
|
| Use Constraints |
|
| Access Constraints |
|
| Fees |
|
| Lineage information for: dataset | |
|---|---|
| Lineage Statement | Limited in-house scanning activities and partnerships with other NOAA line offices and international weather services have contributed to the broad and global nature of digitally imaged records available from the archive. Charts derive from many governmental and private organizations. A limited selection of this massive collection are available digitally; the digital collection spans years 1906-1989, though most forms are from the 1940s. |
| Processor |
|
| Processing Steps |
|
| Processing Environment | Paper forms captured digitally using various types of scanning equipment. All forms were scanned using a minimum of 300 dpi (standard archive quality). |
| Source Datasets |
|
| Lineage information for: repository | |
|---|---|
| Processing Steps |
|
| Acquisition Information (collection) | |
|---|---|
| Instrument |
|
| Platform |
|
Last Modified: 2023-09-08
For questions about the information on this page, please email: ncei.info@noaa.gov
For questions about the information on this page, please email: ncei.info@noaa.gov